- The measurement system matters more than the metrics inside it: get the system right and the numbers finally mean something.
- AI visibility is four questions, not one score: does AI know you, trust you, recommend you, and does any of it move the business?
- Build measurement backwards from business objectives, not forward from whatever data is easy to pull.
- Metrics, KPIs, benchmarks, and scores are different layers; collapse them and your reports fill slides instead of guiding decisions.
- A trustworthy system is repeatable, comparable, consistent, business-aligned, and interpretable, and the real test is whether you'll still trust it six months from now.
Traditional SEO reporting was built for a world where visibility meant a position on a page. You had a rank, the dashboard reflected it, and that was more or less the whole story.
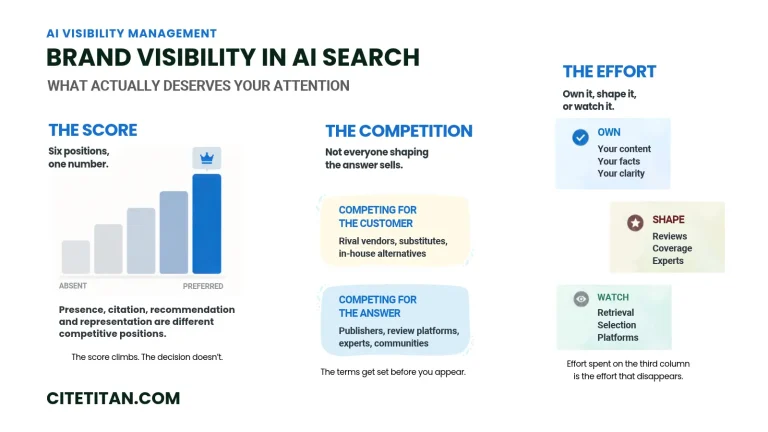
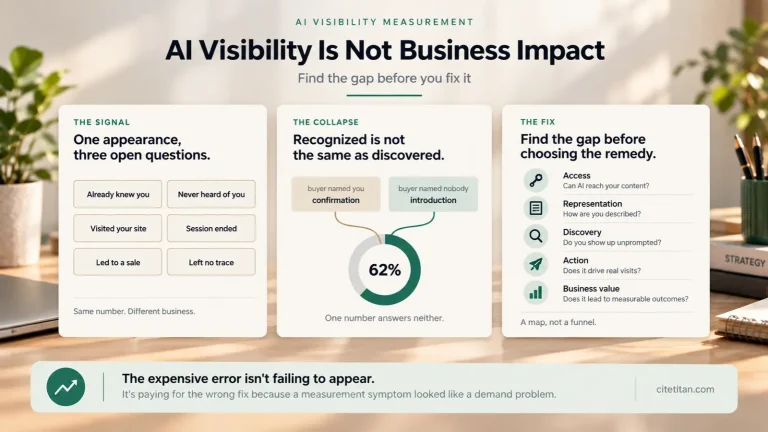
AI search changed what visibility means, while many teams still rely on measurement systems designed for traditional search. The answers AI systems produce are probabilistic and synthesized, shaped by the specific way a query gets framed, the platform handling it, and what the model was trained to weight. A brand can be mentioned without being cited, cited without being recommended, and recommended without driving any measurable business outcome. Each of those gaps requires a different response. A single visibility score won’t tell you which one you’re in.
This article argues that the measurement system matters more than the metrics inside it. Get the system right, and the metrics become meaningful. Get it wrong, and even the right metrics produce the wrong conclusions.
Measuring AI Visibility Requires a Different Measurement Model
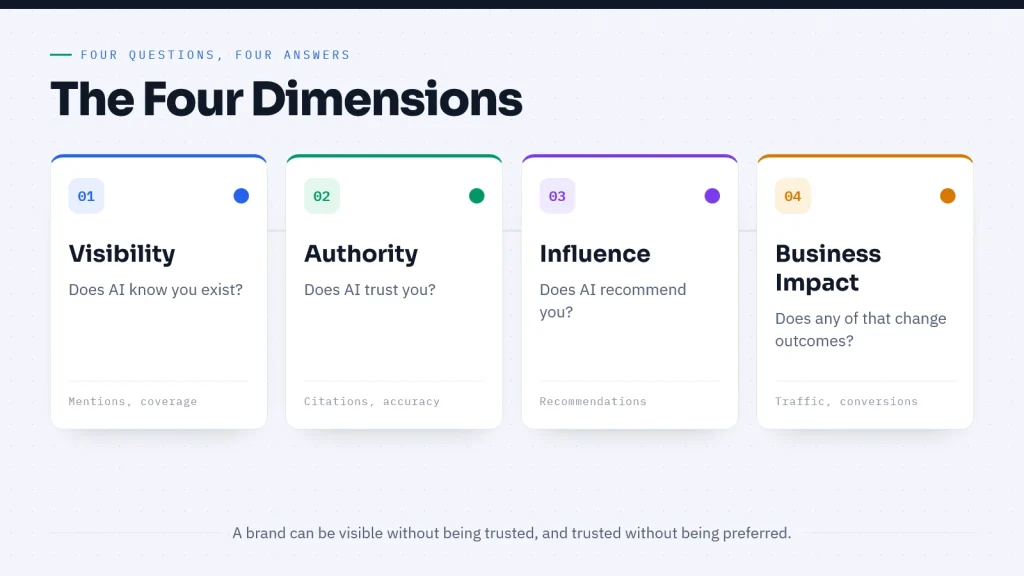
AI visibility is easy to treat as one thing. It isn’t that simple. Think of it as four questions that need separate answers:
- Visibility: Does AI know you exist?
- Authority: Does AI trust you?
- Influence: Does AI recommend you?
- Business Impact: Does any of that change business outcomes?
A brand can be visible without being trusted, trusted without being preferred, and preferred without moving any commercial needle. The interesting questions often live in the gaps between dimensions. A model that collapses all four into a single score hides exactly that.
Start with metrics, and you’ll measure what’s easy. Start with business objectives, and you’ll measure what actually matters.
Build the Measurement System Before Choosing Metrics
The pull is almost always toward the tools first. Teams find what can be tracked, pull the numbers, and build a report around what exists. The result is usually a detailed dashboard that answers questions nobody actually asked.
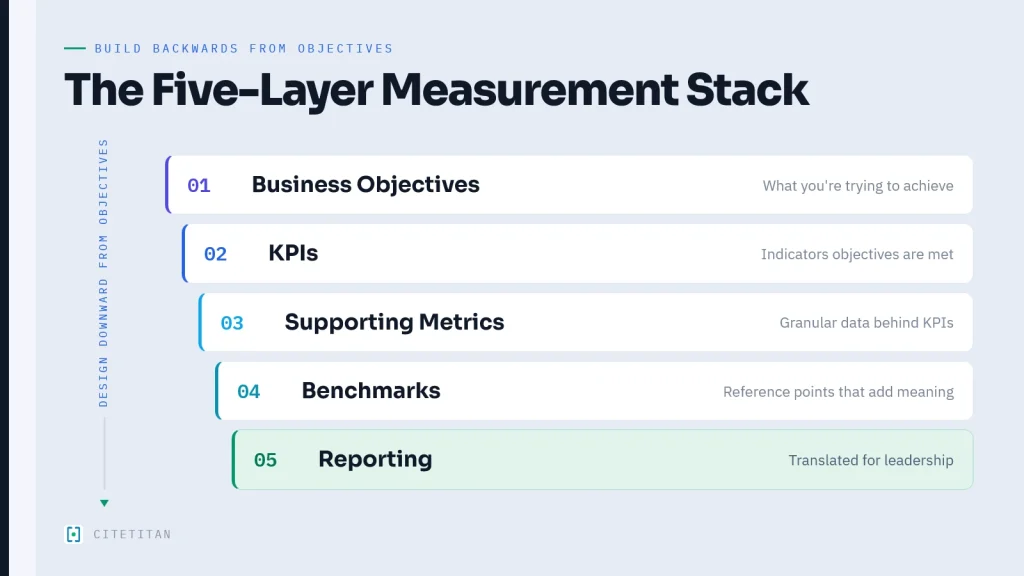
The better approach flips the process entirely. Start with the business objective. What does the organization need AI visibility to do? Drive branded awareness, protect category share, support pipeline, or influence consideration? That question determines which KPIs belong in the measurement system, which supporting metrics sit underneath them, what benchmarks are worth tracking, and how reporting should be structured.
One practical way to structure the measurement stack is across five layers:
- Business Objectives: what the organization is trying to achieve through AI visibility.
- KPIs: the specific indicators that show whether those objectives are being met.
- Supporting Metrics: the granular data that explains why KPIs move.
- Benchmarks: the reference points that make KPI performance readable.
- Reporting: everything above, translated into something leadership can actually use.
Build measurement backwards from objectives, and you track what the business actually needs to know. Build it forward from available data, and you often end up tracking what’s most convenient. Those destinations look similar early on and diverge badly over time.
Metrics, KPIs, Benchmarks, and Scores Are Different Layers of the Same System
Mixing these up produces reporting that looks thorough but can’t support a decision. It happens frequently, often because the pressure to show something arrives before there’s clarity on what that something should be. At a glance:
| Layer | What it is | Example |
|---|---|---|
| Metric | A raw measurement of what happened | Mention rate, citation rate |
| KPI | A metric with a business objective attached and a target set | Mention rate tied to a branded-awareness goal |
| Benchmark | The reference point that makes a KPI readable | 34% against a competitor set or your own history |
| Score | A composite index that aggregates several metrics | An overall 0 to 100 visibility score |
A metric is a raw measurement. Mention rate and citation rate are metrics. They tell you what happened, not whether what happened is good or bad.
A KPI is a metric with a business objective attached and a target set. Mention rate becomes a KPI when someone has decided it matters for a specific reason and defined what progress looks like.
A benchmark is what makes a KPI readable. Without one, a 34% mention rate is just a number. Benchmarked against a competitor set or the brand’s own history, it becomes a position.
Visibility score is a composite index, several metrics aggregated into one number. Think of it like the warning light on a car dashboard. It tells you something changed. It won’t tell you whether the problem is the battery, the engine, or the brakes.
A metric with no owner and no objective is overhead dressed up as a measurement.
Teams that keep these layers distinct tend to build reports that change decisions. Teams that collapse them tend to build reports that fill slides.
AI Visibility Metrics That Matter
The metrics worth tracking can be organized around the four dimensions introduced earlier. These aren’t an exhaustive inventory. They’re the ones most likely to change what teams do next.
Visibility
Mention Rate is where the measurement tends to start and where it tends to stay. Presence and authority look identical at this level, but they’re not. A brand can appear in dozens of responses without being treated as a credible source in any of them.
Prompt Coverage is probably the metric that exposes weak measurement programs fastest. A 70% mention rate across 50 carefully chosen prompts means something entirely different from a 40% mention rate across 300 prompts that reflect actual user behavior. One is a measurement. The other is a mirror.
Share of AI Voice puts the Mention Rate in a competitive context. Without it, a strong mention rate can mean market leadership or a narrow prompt set. The number alone won’t tell you which.
Authority
Citation Rate and Mention Rate often diverge, and the gap between them can be one of the most revealing signals in an early AI visibility program.
Citation Rate measures how often a brand is cited as a source rather than mentioned in passing. When Mention Rate is the only signal being tracked, the gap between recognition and authority tends to show up several reporting cycles later, by which point it may be harder to close. A brand is mentioned when an AI system includes it in a response. A brand is cited when the system treats it as a source worth referencing. The optimization work that follows looks nothing like the work you’d do to improve mention rate.
Citation Quality is a metric many teams skip early, which is understandable given that it’s harder to measure than Citation Rate. It’s also where reputational problems often show up first. High citation volume with poor accuracy is a risk that doesn’t surface in a mention rate report.
Brand Accuracy measures how correctly AI systems represent a brand’s products, positioning, and claims. Brand Accuracy tends to get added to the measurement program after it’s already been needed.
Influence
Recommendation Rate is a useful metric for measuring how often a brand is actively recommended in response to decision-stage prompts. Appearing in an informational response and being named as the answer to a purchase decision are different commercial outcomes. Teams that don’t separate these signals tend to find out why it matters at the pipeline review.
Preferred Brand Frequency can track a brand’s position within recommendations. Consistent third-place finishes with a strong Recommendation Rate are a different strategic situation from consistent first-place finishes. Treating them as equivalent leads to optimization work aimed at the wrong problem.
Business Impact
AI Referral Traffic connects visibility to sessions. Current attribution methods often undercount actual AI-influenced visits, so low numbers warrant investigation before they warrant conclusions.
Assisted Conversions tracks conversions where AI Referral Traffic appears anywhere in the path. Last-touch attribution misses the role AI search plays in decisions that convert elsewhere.
Branded Search Lift measures increases in direct branded search that correlate with periods of increased AI visibility. It’s an indirect signal, but it’s useful when direct attribution is limited.
Benchmarking AI Visibility the Right Way
People ask for industry benchmarks constantly, though none yet exist with the stability they do in organic search. Expecting a universal standard here is like asking what a good conversion rate is without knowing the industry, the price point, or the traffic source.
One practical way to structure benchmarking is around four reference points:
- Historical benchmarks compare current performance against the brand’s own prior periods. They’re the most defensible signal of directional progress because they control for methodology.
- Competitor benchmarks compare performance against a defined competitive set across the same prompt cohort. Different prompt sets for different brands produce comparisons that reflect the samples, not the competitors.
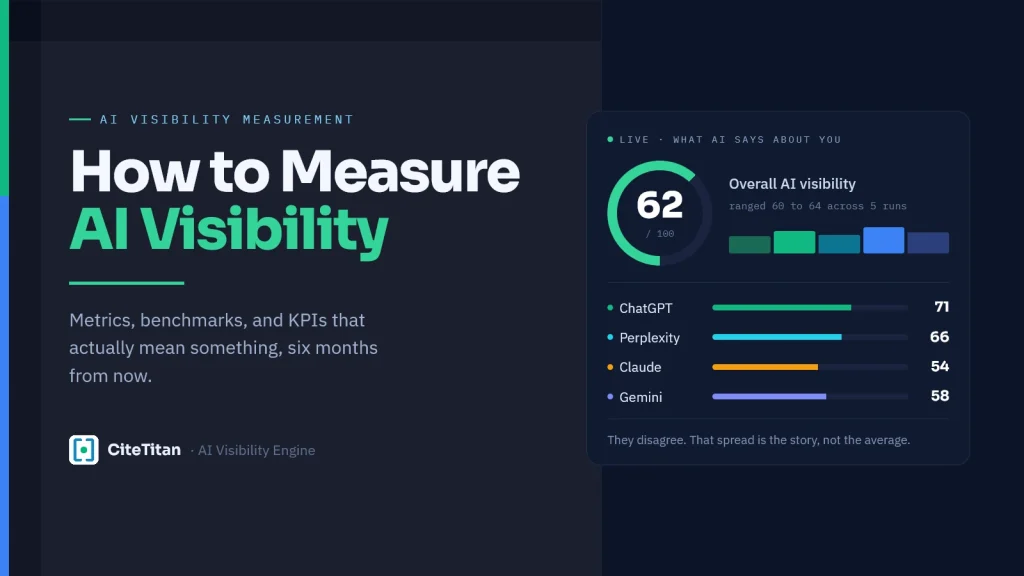
- Platform benchmarks deserve their own view. It sounds obvious that GPT, Claude, and Gemini don’t behave identically. It’s less obvious how much that affects aggregate numbers until you look at them separately.
- Prompt cohort benchmarks track performance within segmented prompt sets over time. Awareness, consideration, and decision-stage queries often move differently. Mix them into one cohort and the averages become almost impossible to read.
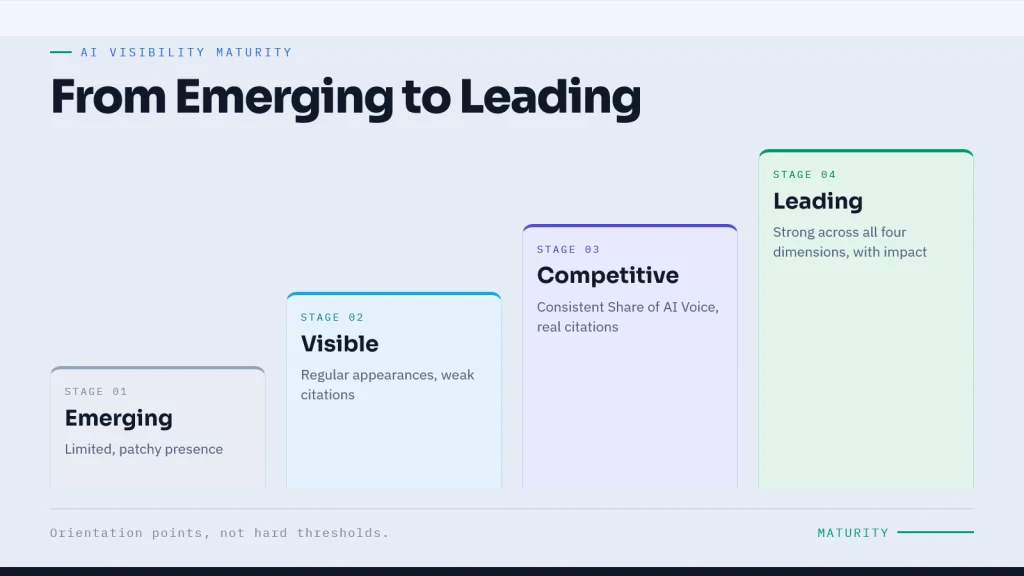
One useful heuristic is to think of AI visibility maturity as progressing through recognizable stages:
- Emerging: limited, patchy presence across prompt sets.
- Visible: regular appearances without strong citation or recommendation signals.
- Competitive: consistent Share of AI Voice with meaningful citation activity.
- Leading: strong performance across all four dimensions, supported by business impact data.
These aren’t hard thresholds, just orientation points.
Five Rules for Trustworthy AI Measurement
If there’s one place AI measurement programs fall apart, it’s not in choosing the wrong metrics. It’s in building a system that can’t be trusted six months after it was set up.
A team tracks 300 prompts in July and adds 150 more in August. The Mention Rate goes up. The instinct is to call it progress. The better instinct is to ask whether the measurement changed before concluding that performance did. Teams may discover this when different reports begin telling conflicting stories in the same quarterly review, at which point the credibility of the entire program comes into question.
Every trustworthy AI measurement system needs five things, and missing any one of them makes the data harder to defend than it should be:
- Repeatable: same prompts, same platforms, same process, every time. If today’s prompt list isn’t yesterday’s prompt list, today’s trend line isn’t yesterday’s trend line either.
- Comparable: results from one period can be set meaningfully against results from another. This breaks when methodology shifts between cycles without documentation, and it breaks quietly, sometimes across two or three reporting cycles before anyone notices. The fix is documentation and a standing rule that methodology changes get flagged explicitly rather than absorbed silently into the next cycle.
- Consistent: the methodology doesn’t change between periods in ways that make historical data unreliable. Adding platforms or rotating prompt sets mid-program changes how historical results should be interpreted. The data looks the same. The conclusions you can draw from it don’t.
- Business-Aligned: every metric has an owner and a reason to exist. A system that produces data nobody acts on has stopped being a measurement system.
- Interpretable: the people reading the reports understand what the numbers mean and what they suggest doing next. That sounds obvious until a report lands in front of a CMO who has three minutes and no context for what a 34% mention rate implies about anything.
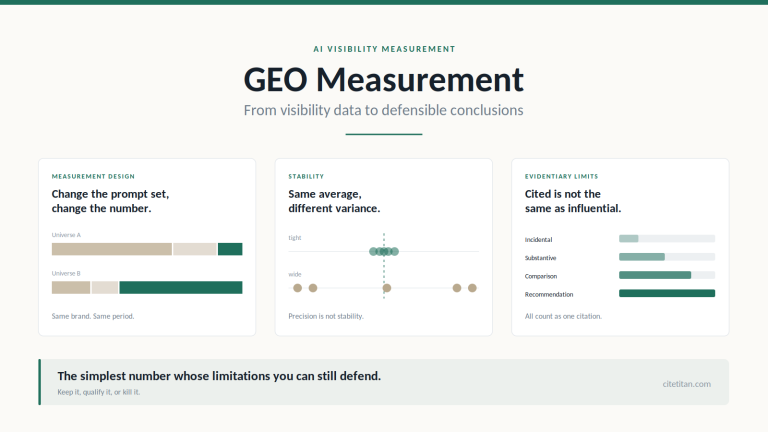
Prompt governance supports all five. Prompts need to be documented, versioned, and held stable. Narrow prompt sets can produce false confidence. Broad ones without segmentation produce numbers that are hard to read in any direction. Segmenting by intent stage, topic cluster, and competitive context shows whether visibility is growing across the full funnel or concentrated in a narrow slice of it.
For many organizations, monthly tracking with quarterly strategic reviews provides a practical balance: frequent enough to catch real shifts without generating overhead that outpaces anyone’s ability to act on it.
Interpreting AI Visibility Measurements
Individual metrics tell you what happened. The relationships between metrics tell you what it means. AI visibility reporting tends to stop at the first layer.
The signal pairs below aren’t diagnostic formulas. They’re the patterns that show up when something real is shifting, and knowing what each suggests changes what you investigate next:
- Mention Rate rising, Citation Rate flat or falling: Recognition is growing while authority isn’t following. A sourcing problem and a visibility problem need different fixes, and conflating them can send optimization work in the wrong direction until the underlying issue is identified.
- Citation Rate rising, Recommendation Rate flat or falling: AI systems are treating the brand as a reference but not as a recommended answer. The brand is well-represented in informational content but underrepresented at the moment of decision. That difference often mirrors the gap between content authority and commercial relevance, and the two require different responses.
- Recommendation Rate rising, AI Referral Traffic flat or falling: Recommendations are increasing without a corresponding rise in measured sessions. Before drawing conclusions about commercial performance, check whether attribution is undercounting AI-influenced traffic, as current methods often do. Zero-click behavior is worth ruling out too.
- Share of AI Voice rising, Prompt Coverage flat or falling: The brand is consolidating rather than expanding. That can limit future growth, and identifying it early gives teams room to act before it becomes a plateau worth explaining to leadership.
What makes these pairs useful isn’t the patterns themselves. It’s the discipline of looking at them together. A Mention Rate report tells you one thing. Read alongside a Citation Rate trend, it tells you something else entirely. That difference is usually where the actual strategic question lives, and it stays invisible until you look for it.
Reporting AI Visibility to Decision-Makers
Giving leadership every available metric is a reliable way to ensure none of it gets used.
Executive reporting centers on KPIs, trend direction, competitive position, and business impact metrics. The supporting detail belongs in operational reporting, not in a slide that gets forty seconds of attention before the meeting moves on.
A CMO and a Head of SEO need different cuts of the same data. The CMO wants the business impact story. The Head of SEO wants Prompt Coverage trends and Citation Quality breakdowns. One report distributed to both tends to get skimmed by both and acted on by neither.
Monthly reporting covers metric movement and emerging trends. Quarterly is where the measurement system itself gets evaluated and adjusted where the data suggests it needs to be.
Common AI Visibility Measurement Mistakes
Running measurement on a single prompt or a single platform is a common way to generate confident-looking data that often doesn’t hold up. Checking three keywords and drawing conclusions about organic search performance is the same mistake with a different label on the dashboard.
Trusting a composite visibility score without interrogating the underlying metrics produces a related problem. A rising score can mask deterioration in specific dimensions. A brand whose Mention Rate is climbing while the Citation Rate and Recommendation Rate are falling may not be in a stronger position, regardless of what the composite suggests.
Changing methodology between measurement periods breaks historical comparability in ways that are easy to miss and hard to recover from. The trend data may still appear meaningful. It may no longer support the conclusions being drawn from it.
Tracking activity rather than outcomes is a common measurement mistake in AI visibility programs. The number of prompts run, the number of platforms monitored, and the volume of mentions captured describe how the measurement program is running. They say little about how AI visibility itself is performing.
Comparing prompt sets that don’t share the same intent stage or competitive context produces numbers that aren’t directly comparable. When someone builds a strategy around closing a gap that exists because of methodology rather than performance, the problem isn’t the numbers. It’s the question being asked of them.
Frequently Asked Questions
How often should AI visibility be measured?
For many organizations, monthly tracking provides enough frequency to identify trends without generating reporting volume that outpaces the team’s capacity to act on it. Quarterly strategic reviews are where those trends connect to business objectives and where the measurement system itself gets evaluated. Cadence matters less than consistency. A team that measures quarterly but holds methodology steady will produce more defensible trend data than one that measures monthly but changes the prompt set every cycle.
Can AI visibility be benchmarked?
It can, but the benchmarks have to be constructed rather than borrowed. Universal industry benchmarks don’t yet exist with the stability they do in organic search. The most defensible starting points are historical baselines built from the organization’s own measurement over time and competitive benchmarks built from tracking the same prompt set across a defined competitor group. As the field matures, external benchmarks are likely to become more useful. For now, the comparison that matters most is the one you built yourself.
Why do AI visibility measurements fluctuate?
AI-generated responses can vary across runs because modern generative models are probabilistic, and many AI search systems also incorporate retrieval results and ranking signals that change over time. This is a property of how these systems work, not a measurement error. It’s also why point-in-time readings matter less than trend analysis over multiple consistent periods. A single data point tells you what happened once. A series of them tells you something worth acting on.
What is the difference between AI visibility metrics and AI visibility scores?
Metrics are individual measurements: mention rate, citation rate, and recommendation rate. Scores are composite indices that aggregate multiple metrics into a single number, usually weighted by perceived importance. Scores work well for executive summaries and trend monitoring. Metrics are what you need when something moves, and you want to know why.
What is the difference between an AI visibility audit and ongoing measurement?
An audit is a point-in-time assessment of where a brand stands across AI platforms and prompt types, useful for establishing a baseline or diagnosing a specific problem. Ongoing measurement is a repeatable system that tracks performance over time, making it possible to separate genuine performance shifts from normal AI variability. An audit can inform how the system gets set up. It can’t replace the longitudinal insight that only consistent measurement over time can build.
Conclusion
Six months from now, the models will probably behave differently. The past few years suggest they will. The question worth sitting with is whether your measurement system will tell you the difference between a real shift in performance and a change in how the model answered the question.
That question only has a clean answer if the measurement system was built to answer it: consistent methodology, stable prompt sets, and benchmarks constructed from the brand’s own history rather than borrowed from standards that don’t yet exist. Many teams discover they can’t answer it confidently, often at exactly the wrong moment.
More metrics don’t make measurement better. A system you can trust six months from now does. The dashboard can only tell a coherent story if the system behind it was built to tell one.
CiteTitan runs this measurement for you: it puts your buyers’ real questions to ChatGPT, Perplexity, Claude, and Gemini, scores where you stand on each, and reports the range across runs so you can tell a real shift from day-to-day noise. Run a free analysis to see your own scores across all four engines, or explore more guides on the CiteTitan blog.