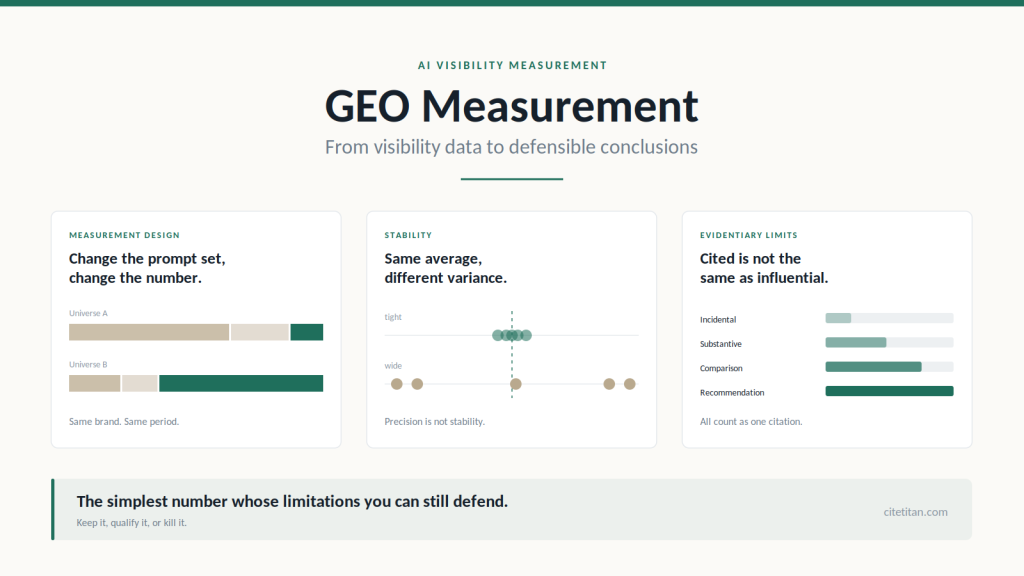
- Your GEO score is only meaningful when you know exactly which queries and prompts it represents.
- Being cited by AI doesn’t necessarily mean your content influenced the final recommendation.
- Overall visibility can improve while your competitive position gets worse, so benchmark against competitors.
- A precise GEO percentage isn’t necessarily a stable one, so read visibility as a distribution across repeated runs rather than a single figure.
- Focus on GEO metrics that drive real business decisions, and eliminate metrics that don’t.
In GEO measurement, it’s surprisingly easy to produce a precise number and surprisingly hard to produce a precise conclusion.
A visibility score can move for reasons that have nothing to do with actual visibility. Maybe the prompt universe shifted. Maybe a sampling condition changed. Maybe an aggregate improved while decision-query visibility quietly deteriorated.
The number goes up. The underlying position may not have.
What a GEO measurement actually establishes, and whether that’s strong enough to support the conclusion attached to it, is a harder problem than most measurement systems acknowledge.
Your GEO score is partly a measurement-design decision
A GEO visibility score is the output of measuring a brand across a defined set of prompts, platforms, audiences, competitors, and sampling conditions. Change any of those inputs and the number can change without the underlying visibility necessarily changing at all.
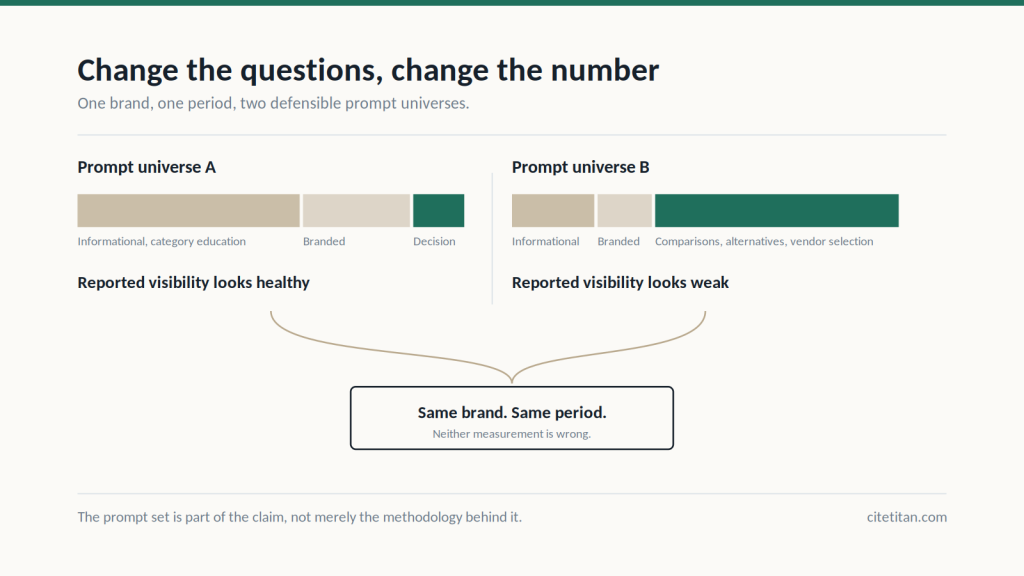
Two GEO measurement providers can run independent analyses of the same brand in the same period and return different visibility rates without either necessarily being wrong: they built different measurement universes and got different answers from them.
A team can improve its reported GEO score by changing the prompt universe rather than improving its underlying visibility. A measurement set heavy on informational queries, branded questions, and category education can produce very different visibility figures from one weighted toward comparisons, alternatives, and vendor-selection prompts, and the gap can be substantial. If the former is what’s being tracked, the number looks healthy. Whether the brand has decision-query visibility is a separate matter the metric may not be addressing.
Broader prompt coverage gives wider reach but can introduce noise and dilute the commercial signal. A tighter, high-value set can be more decision-relevant but produces smaller samples and potentially less stable aggregates. The choice has costs either way. What matters is whether the people reading the score understand which decisions shaped it and whether those decisions were deliberate or inherited from a vendor default.
The number reflects the questions behind it: change the questions, and the number can change.
A citation is evidence of selection, not proof of influence
Citation rate is observable, scalable, and benchmarkable. It’s also a GEO measurement often asked to answer questions it can’t support.
What a citation establishes is that a source was selected and attributed in an AI-generated answer. How much that source shaped the answer is a different matter. A brand cited for a peripheral factual claim and a brand whose evidence anchors the answer’s central recommendation can carry identical citation counts. The basic citation rate treats these as equivalent. They aren’t, and the difference can matter commercially.
A source can appear as incidental support, as substantive evidence, as the basis for a comparison, or as the direct rationale for a recommendation. These aren’t equivalent forms of contribution.
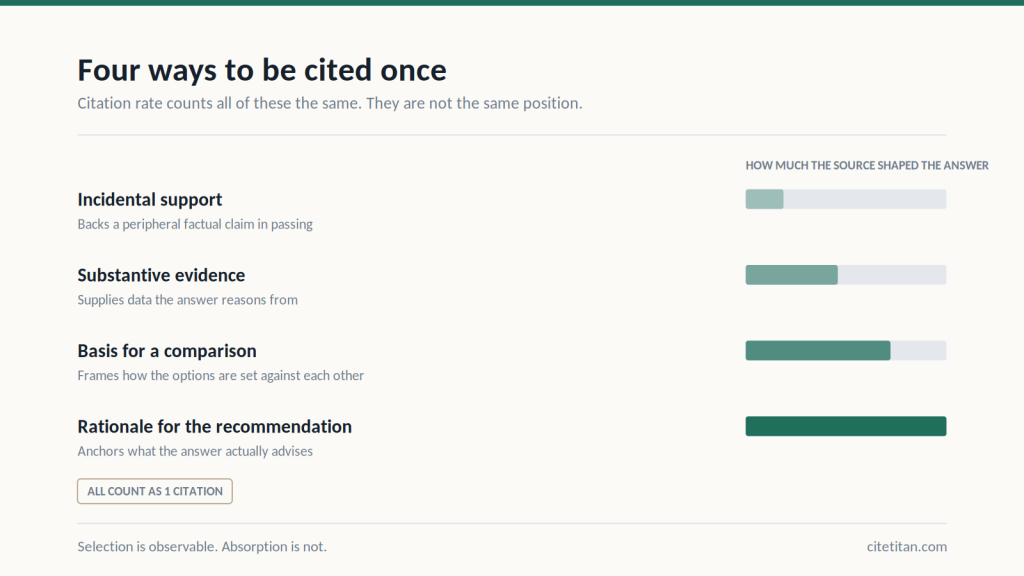
Citation selection is not the same as citation absorption. Selection is observable and measurable, while how deeply a source’s framing or evidence was absorbed into the answer is harder to establish, and no widely accepted method for measuring absorption exists yet.
That gap influences how citation metrics get interpreted. A rising citation rate can mean the brand is being selected more often as a source in its category. It can also mean it’s appearing more frequently in peripheral factual contexts while competitors own the recommendation and comparison answers where decisions form. It can mean the answer environment itself shifted.
Citation rate alone can’t tell you which situation you’re in.
The question worth asking of any citation metric isn’t whether it’s going up. It’s what business claim you’re trying to make from it and whether the metric contains the evidence that claim requires. Citation rate supports the claim that a source is being selected within the measured universe.
If the claim is that the brand is shaping how AI systems represent the category, that requires evidence the citation count isn’t providing.
You can improve your GEO score while losing the questions that matter
Aggregate GEO visibility can improve while a brand’s decision-query visibility deteriorates. These aren’t in tension; they can happen at the same time.
A brand’s measured visibility moves from 25% to 40%, a genuine improvement within the measured universe. But if the gain is concentrated in informational queries while competitors continue dominating comparison searches, alternatives prompts, and vendor-selection questions, the aggregate figure shows only part of what changed. Measured visibility improved. Recommendation visibility may not have moved.
That doesn’t make aggregate visibility unhelpful; it makes it insufficient as a standalone proxy for commercial position. The number can be accurate and still be answering a narrower question than the business thinks it’s answering.
There’s a second version of this that aggregate reporting can obscure. Suppose measured visibility moves from 25% to 40% while a primary competitor moves from 30% to 65% in the same period. The metric improved. The competitive position didn’t.
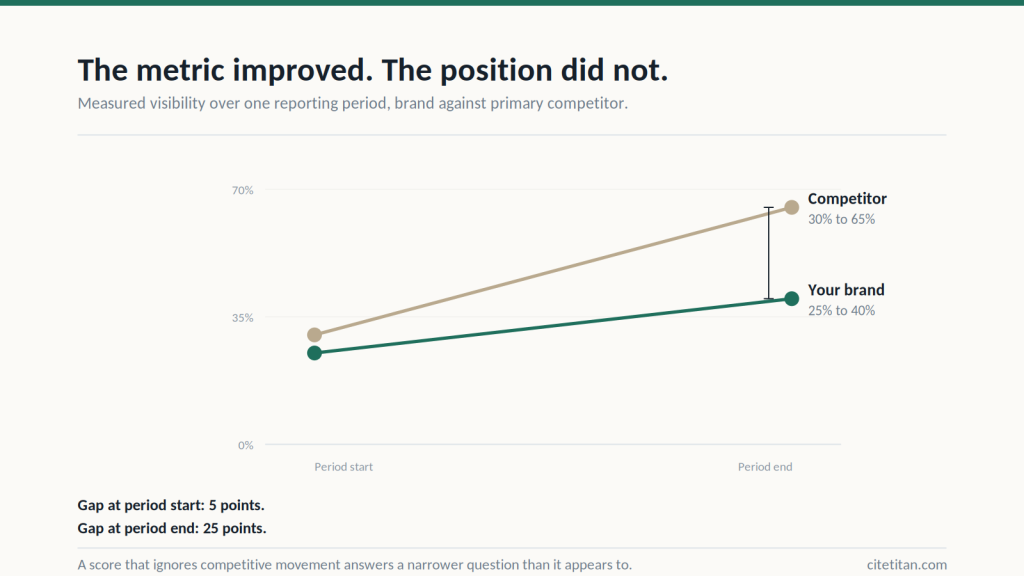
GEO visibility can be read in absolute terms and relative to competitors, and a GEO measurement that doesn’t account for competitive movement answers a narrower question than it appears to.
What constitutes a commercially important query depends on the business model in ways that generic intent segmentation doesn’t fully capture. For example:
- In ecommerce, recommendation and comparison queries can sit close to a transaction.
- In B2B, AI discovery can initiate a longer consideration cycle, with some GEO interactions occurring at the awareness stage rather than the decision stage.
- In local, a recommendation can translate more directly into a visit.
The queries that matter are the ones where the audience is forming or finalizing a decision, and aggregate visibility figures can move very differently from performance on those specific queries. Even when the measurement is well-designed and the interpretation is defensible, there’s still a prior question worth asking about the number itself: how much confidence does the observed movement actually deserve?
A more precise GEO number isn’t necessarily a more trustworthy one
Precision makes a number look more certain than it may be.
A visibility figure of 43.7% feels more credible than “roughly 40 to 45%.” But precision describes how specifically an observation is quantified, not how much the conclusion drawn from it deserves trust.
Some of this variability is inherent to the way AI-generated answers are produced and measured. Answers vary across repeated runs, prompt variations, platforms, time, and sampling conditions.
GEO visibility should be treated as a distribution rather than a single point estimate, precisely because single-run measurements can misrepresent underlying stability. A point estimate can be reported with high precision without being stable. One study of four AI search engines found that identical prompts re-run within the same day returned source sets overlapping only 32 to 43 percent of the time, and estimated that roughly seven runs per prompt are needed before a per-brand visibility figure carries a standard error below 0.10.
Two brands report roughly the same average visibility, call it 50%. Brand A’s underlying observations are 47%, 51%, 52%, 49%, and 50%. Brand B’s are 5%, 94%, 12%, 86%, and 53%. Brand A’s figure reflects visibility that is relatively consistent across these observations. Brand B’s average conceals visibility that may be heavily dependent on specific prompting conditions or answer contexts.
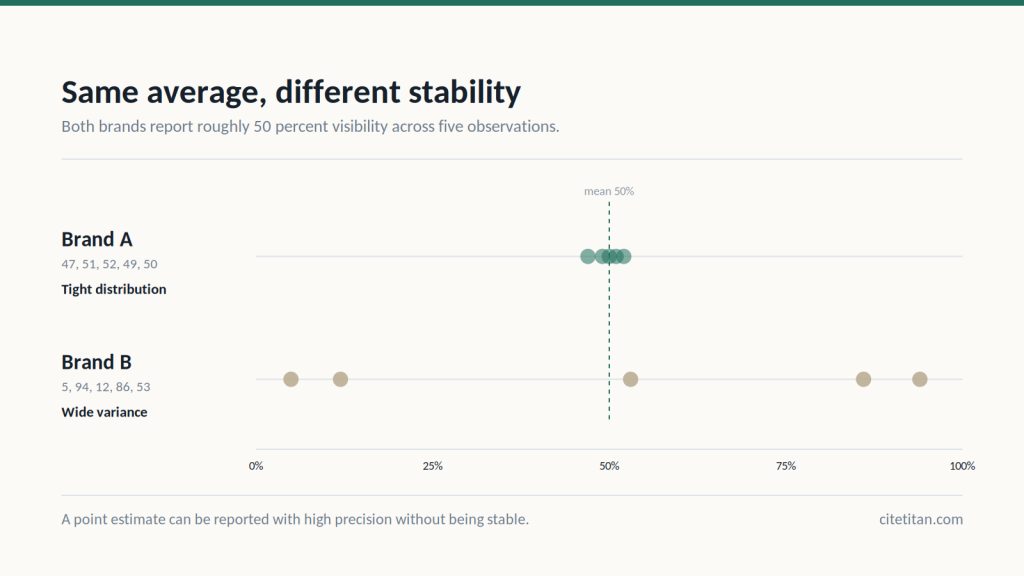
High variance in GEO visibility can reflect inconsistent source coverage, unstable answer structures, or competitive dynamics that shift across prompt conditions, none of which the average surfaces. A brand with strong average visibility but wide variance is in a different situation than one with the same average and tight distribution.
First ask whether the number changed enough to distinguish a shift from the variation the measurement naturally contains. Then decide whether to act on it.
GEO measurement should make the next decision clearer
A GEO measurement justifies its place when it supports a better decision.
For diagnostic measurement, the question is whether the evidence can distinguish between competing explanations of a problem. When a brand is absent from an important AI answer, that observation alone doesn’t point toward a cause.
- The issue might be retrieval: relevant information about the brand isn’t being surfaced.
- It might be selection: the system has relevant information but chooses other sources.
- It might be representation: the brand appears but is framed in ways that diminish its prominence or relevance.
- It might be competitive preference: the brand is present but loses to alternatives in how the competing sources are selected or represented.
- Or the absence might partly be a measurement artifact: a function of prompt design, sampling, or normal variation.
Each of those points toward a different investigation. A top-line GEO measurement can be accurate and still be operationally weak if it can’t indicate which situation you’re in.
Before-and-after interpretation carries the same limitation. A visibility increase following a content initiative doesn’t establish that the initiative caused it.
Model updates, competitor changes, source rotation, shifts in external coverage, and normal variation are all possible explanations a simple comparison can’t rule out.
GEO measurement identifies what changed. Attribution is a separate and harder problem.
What that means for business impact: referral tracking, which counts visits, leads, and conversions attributed to an AI source, is the cleaner measurement case for directly observable outcomes, but it captures only part of AI influence.
AI exposure can affect branded search behavior and direct traffic in ways that don’t always produce a traceable referral, and it may also influence later stages of the buying journey. For longer-cycle businesses, the distance between AI exposure and a conversion can extend well beyond the initial interaction.
Referral data is one part of the picture, and treating it as complete understates the role AI may be playing in the customer journey.
A practical test for your GEO measurement
The five judgments above change how GEO measurement should be read. This section turns that into an audit, not by prescribing which metrics to build, but by giving you a way to evaluate what you already have.
For each metric: does this measurement deserve to influence a decision?
Can you defend the measurement universe?
Start with the prompt set. Why these prompts? Who generated them and against what criteria? What customer decisions do they represent? What proportion are branded versus unbranded, informational versus decision-oriented? Which competitors are included?
Because the number reflects the questions behind it, the prompt set isn’t neutral infrastructure; it helps define what the metric means. If changing the prompt mix would materially change the headline number, the prompt set is part of the claim, not merely the methodology behind it.
Push that one step further: if two reasonable prompt universes produce materially different business conclusions, the disagreement isn’t necessarily a measurement problem. It may be that the two teams have made different prior decisions about what counts as visibility in the first place.
That’s a strategic disagreement that no amount of methodological refinement resolves because the question isn’t which measurement is more accurate. It’s which definition of visibility the business actually intends to hold itself against.
Can you explain what each metric actually establishes?
Because citation and visibility signals don’t prove influence, every metric gives permission to make some claims and not others. This table makes those boundaries explicit:
| Metric | It establishes | It does not establish |
| Presence / mention | The brand appeared in the answer | Influence or commercial impact |
| Citation rate | The source was selected and attributed | Degree of influence on the answer |
| Position/prominence | Where and how visibly it appeared | Likelihood of conversion |
| Share of voice | Relative visibility in the defined universe | Market share or competitive dominance |
| Referral traffic | An observable visit from an AI source | Total AI influence on the decision |
| Conversion | An observable downstream outcome in the measurement window | That AI caused it |
For each row, ask: what am I allowed to conclude from this metric?
A metric can be perfectly accurate and still produce a misleading report if the conclusion attached to it is stronger than the evidence it contains. The problem isn’t always bad measurement; it can be good measurement being asked to prove too much.
Could the metric improve while the business gets worse?
Because aggregate visibility can diverge from commercial and competitive positions, this question applies to every metric in the system.
In practice, the answer is yes in more than one way:
- For aggregate visibility, yes, if the prompt universe gives disproportionate weight to queries that are less relevant to the business decision being measured.
- For citation rate, yes, if citations are concentrated in peripheral contexts while competitors own recommendation and comparison answers.
- For share of voice, yes, if the competitive set is defined too narrowly.
- For referral traffic, yes, if AI drives visits that don’t convert while direct and branded channels weaken.
If the answer is yes, the metric needs a qualifying dimension or shouldn’t be interpreted independently.
A number that can improve while the business weakens may be tracking genuine activity without establishing business progress.
Can you tell a real change from a measurement or environment change?
Because precision doesn’t equal stability, a real change in the number isn’t automatically a real change in underlying performance. Before reporting that GEO visibility increased 8%, ask:
- Did the prompt universe remain comparable from period to period?
- Did the platform or model environment remain comparable?
- Did the sampling methodology remain consistent?
- Is the movement outside the measurement’s normal variation?
- Does it persist across multiple observation windows?
- Did competitors move in the same direction?
A movement that fails several of those checks shouldn’t yet be treated as a performance trend. It’s a hypothesis.
There’s a tension this surfaces that’s worth naming. The GEO measurement environment evolves: platforms change, models update, prompt norms shift, and a measurement system needs a deliberate way to evolve with it.
But a system that changes its methodology too often may become less capable of detecting genuine performance change, because there’s no stable baseline to measure against. Methodological evolution and measurement continuity pull in opposite directions, and managing that tension deliberately is part of what rigorous GEO measurement actually requires.
If the number moves, can you explain what changed?
Because measurement should make the next decision clearer, a visibility shift needs more than a number; it needs a diagnosis.
Measured visibility fell. Possible explanations: the prompt mix changed; a competitor became more visible in the measured answers; the model’s source selection shifted; the platform changed how it builds answers; the signal is within normal variation. These point toward different investigations and different responses. Treating them as interchangeable can produce interventions aimed at the wrong problem.
Ask: what evidence would distinguish one explanation from another? A dashboard can make you more certain about the existence of a problem while making you no better at understanding what caused it. If several materially different explanations can produce the same observed movement, the next thing you may need isn’t another KPI; it’s evidence designed to discriminate between those explanations.
Can the executive number answer the practitioner’s questions?
This is where the previous judgments converge. Metrics have evidentiary boundaries. They can diverge from the business position. They carry measurement uncertainty. Diagnosis requires underlying evidence. Taken together, those constraints produce a specific standard for what belongs on an executive dashboard.
The executive metric shouldn’t be the simplest number you can produce. It should be the simplest number whose limitations you can still defend.
A number becomes difficult to work with when its simplicity survives the executive meeting but its assumptions don’t. If the CEO asks why it moved, the practitioner layer underneath should be able to answer not with a confident story retrofitted to the movement, but with the methodological context that makes the movement interpretable. If the underlying measurement can’t answer that, the metric may be suitable for observation or directional monitoring but not yet for decision-grade use.
Keep, qualify, or kill the metric
- Keep: it measures something commercially important, consistently enough to be useful, and supports a decision that matters.
- Qualify: it’s useful but requires an additional dimension or signal to be interpreted safely; keep it with that context visible.
- Kill: it doesn’t support a defensible interpretation or a meaningful decision, even after reasonable qualification. If removing it wouldn’t make any meaningful decision harder, it has no defensible place in the system.
The distinction between qualify and kill matters more than it first appears. Qualify applies when a metric is asking a legitimate question but can’t answer it alone. Kill applies when the metric isn’t connected to a decision worth making, not simply because it has limitations, but because no meaningful decision depends on it.
A GEO measurement system built on that discipline may contain fewer metrics than the current one. That’s not a reduction in ambition; it means the ones that remain are actually doing the job they’re supposed to do.
Some metrics earn removal precisely because they’re easy to understand and report. An easy number can become a default KPI not because it supports meaningful decisions but because no one has had to defend it yet.
The mature measurement system isn’t the one with the most signals. It’s the one with the fewest signals that can still support the decisions that matter. The table below collects the six audit questions and what each one tests.
| Audit question | What you’re testing |
| What exactly are we measuring? | Measurement universe |
| What does this metric actually establish? | Evidentiary boundary |
| Could the number improve while the business weakens? | Metric validity |
| Can we distinguish movement from noise? | Measurement confidence |
| Can we identify competing explanations for a change? | Diagnostic usefulness |
| Does this metric deserve a place in decision-making? | Keep/qualify/kill |
Conclusion
The goal of GEO measurement isn’t to make AI visibility look quantifiable. It’s to know what a given measurement is strong enough to tell you and where it isn’t.
A number can be precise without being stable. Cited without being influential. Improving in aggregate while competitive visibility weakens. Accurate at the top line while saying nothing useful about what’s driving it.
That’s the standard worth holding: not whether a GEO measurement exists, but whether it can survive the questions that matter. One that can’t is producing numbers faster than understanding.